For some problems, such as unresponsive servers/Tentacles and hung tasks, providing a dump or dump analysis of the Octopus Server and/or Tentacle process may speed up diagnosis and resolution.
Create a process dump
A process dump consists of all the memory the process is currently using. This includes deployment variables, credentials and certificates.
Creating a process dump will pause the process for anywhere between a few seconds to a few minutes, depending on the amount of memory in use and the disk speed.
Due to the nature of data contained in a process dump, we take great care in handling these files and will provide a secure upload facility. We will also delete them as soon as they have been analyzed.
If you are capturing a process on your Octopus Server follow the below instructions:
- Right click on the task bar and select Task Manager.
- Select the Details tab.
- Find the relevant process. In this case Octopus.Server.exe
- Right click on it and select Create dump file.
- Note where the file is saved (generally in your temp folder).
When capturing a process dump for Tentacle.exe, please also capture any child Calamari.exe processes. To do this, follow the process below.
We recommend using Process Explorer to capture child processes associated with Tentacle.exe, such as the Calamari.exe process. To capture child processes for Tentacle:
- On the tentacle that is having the issues. Download and install Process Explorer from Microsoft.
- Once installed you need to run the program as an administrator by right clicking on the relevent procexp.exe file and selecting
Run as Administrator. - Once opened you need to make sure the process tree is shown by clicking on the
Viewmenu on the top navigation bar and selectingShow Process Tree. - You will notice the program looks similar to task manager. Navigate to the tentacle.exe process in the list of tasks.
- Run the process that is causing the issue/fault in Octopus (ie run the deployment or task that is failing).
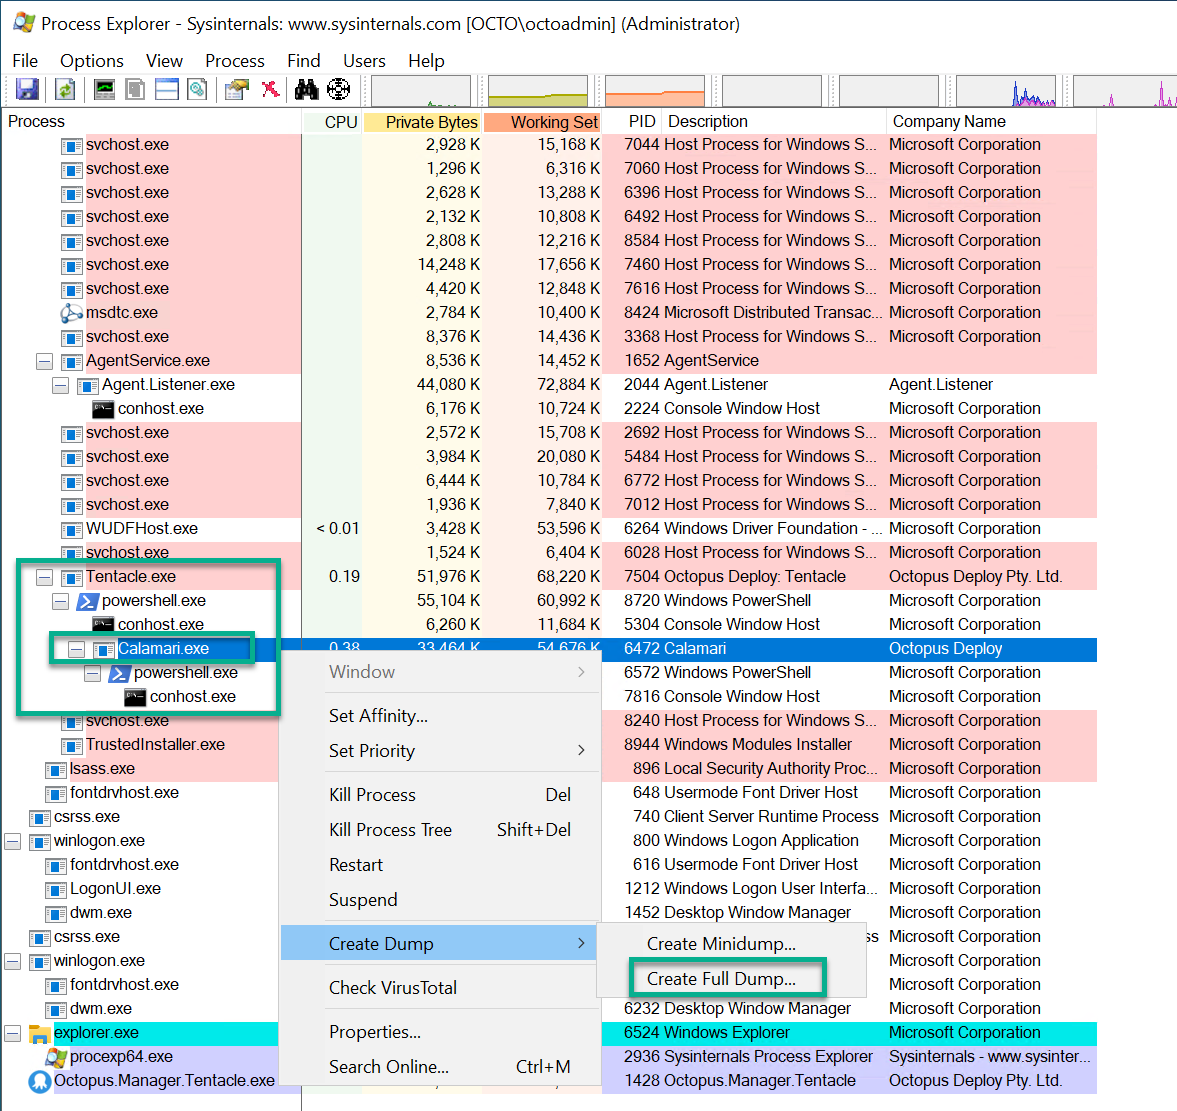
- Once that task is running in Octopus go back to Process Explorer on the tentacle and you will now see the tentacle.exe process can be expanded to show the calamari process. This can be expanded further to see the powershell.exe processes associated with both the tentacle.exe and calamari.exe.
- To capture the dump file for calamari.exe make sure your tentacle.exe process is expanded in process explorer and find calamari.exe.
- Right click on it and select
Create Dumpand thenCreate Full Dump. - Note where the file is saved (generally in your temp folder).
Sometimes the deployment in Octopus can complete or error out too quickly, which means you do not get a chance to capture the failing process. If this is happening get in touch with us and we can suggest some workarounds to make the process last longer so you can capture the dump correctly.
Dump file analysis
This process creates an analysis file from a process dump file. This analysis file contains a limited set of information outlining the current state of the application. This file can contain connection strings, Tentacle thumbprints, project, step and machine names.
It should not contain sensitive variables or certificates. For our purposes it contains for which threads are running and where they are in the code.
This process can be performed on a different computer to the one the dump file was captured on
- Download and install the Debug Diagnostics tools from Microsoft.
- Run
DebugDiag Analysisfrom the start menu. - Check
CrashHangAnalysis. - Click
Add Data Filesand select the dump file. - Click
Start Analysis. - Wait.
The result will open in Internet Explorer. Note the location of the file,
which is usually in <MyDocuments>\DebugDiag\Reports.
Help us continuously improve
Please let us know if you have any feedback about this page.
Page updated on Sunday, January 1, 2023