Out of the box database performance in Octopus Deploy
Every user has different usage patterns of Octopus Deploy with different numbers of projects, targets, releases and packages. As a result no one database indexing strategy will provide a best fit for all installations. Users who are deploying to thousands of targets for a single project each day, will have different database performance metrics to those who have just a few Tentacles, but hundreds of projects which constantly need dashboard updates. For this reason we have been restrained in the use of indexes to a base schema and only added those that look like they will provide benefit on average to most users. It is entirely likely that the database usage that is seen by us during development and testing is not necessarily going to be exactly the same that you experience with your installation and for that reason you may notice a less than optimal performance profile.
In much the same way that we love to get our users involved with the feature planning process, our aim with performance is to work with users to learn how the database is used in the various real-world configurations, and where appropriate integrate that knowledge into future updates with schema and code changes to ensure that everyone reaps the rewards of a faster and more efficient installation.
Can I add my own indexes? While we generally won’t stop you from adding your own indexes if you feel that would provide some performance benefits, we generally advise against this as that then leaves the database schema in a state inconsistent with the base schema generated by the installation. When we create new features or provide bug fixes, this may involve schema changes which we script based on the assumption that the database currently looks like the default schema. Additional changes to this schema may mean that the upgrade will fail to complete.
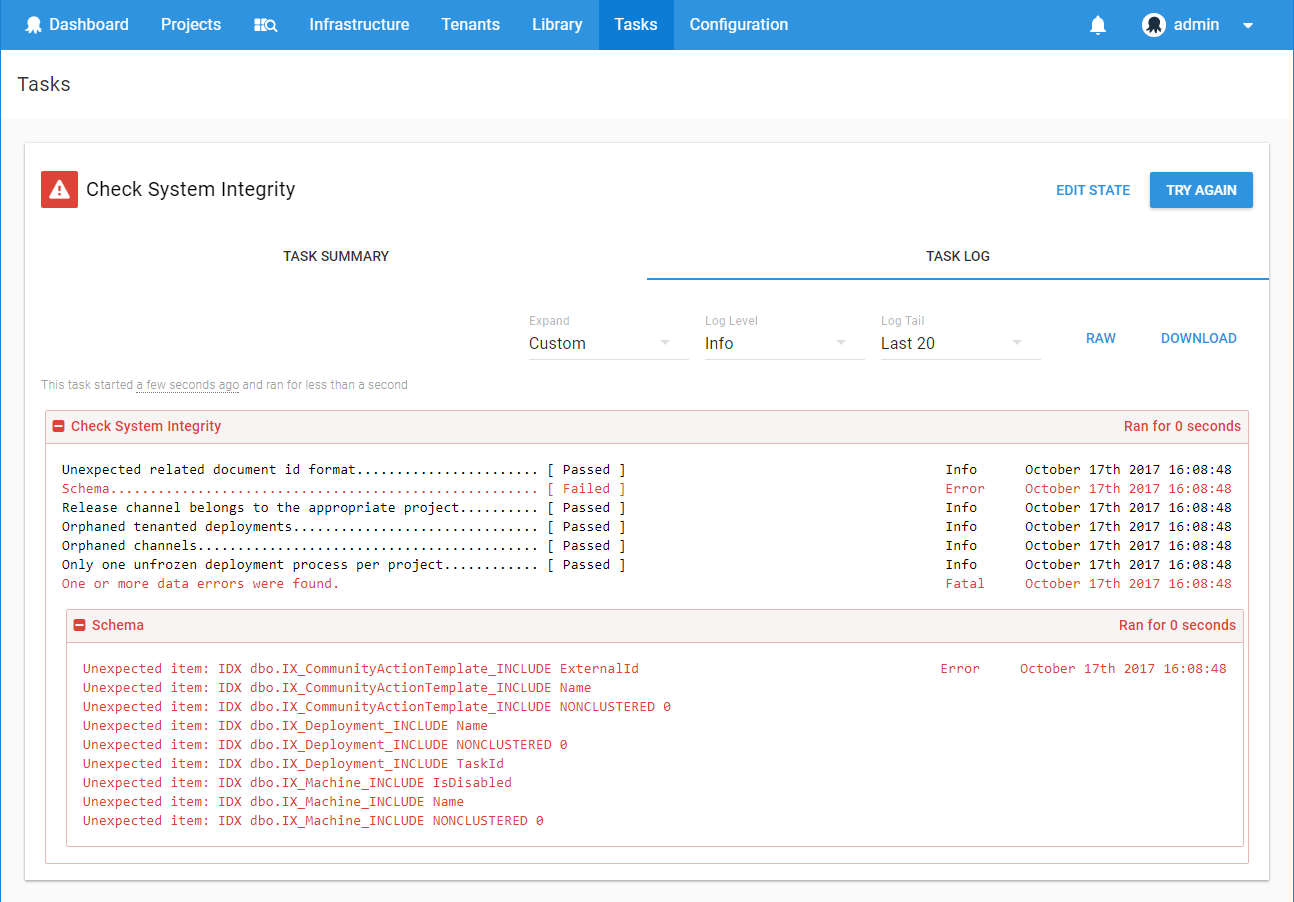
If you want to add your own indexes we would recommend running the System Integrity check (available via Configuration ➜ Diagnostics ➜ Check System Integrity) before performing the upgrade to see what the differences are from the assumed schema. If possible, remove these indexes and feel free to recreate them once the upgrade has completed.
Azure automatic indexes Azure SQL Databases are a great way to set-up your Octopus database to be managed in the cloud. One feature that this product can provide is automatic index management. While this is a great way to set-up your databases and forget about them, allowing Azure to decide and act on potential performance benefits, this means that indexes will be potentially created without you being aware of them. As noted above you will need to be aware what custom indexes exist and remove them before performing an update to the Octopus Server to ensure that any new schema changes can be applied smoothly.
What you can do to help
Missing indexes
When you notice some performance problems that appear to be due to a slow database, we would love to get your database’s recommendations on what indexes may be missing. Run the following query and provide the results (ideally as an attached file) in your support ticket. The query below is taken from a great blog post by Glen Berry - Five Very Useful Index Selection Queries for SQL Server 2005.
Missing indexes
SELECT user_seeks * avg_total_user_cost * (avg_user_impact * 0.01) AS index_advantage, migs.last_user_seek, mid.statement as 'Database.Schema.Table',
mid.equality_columns, mid.inequality_columns, mid.included_columns,
migs.unique_compiles, migs.user_seeks, migs.avg_total_user_cost, migs.avg_user_impact
FROM sys.dm_db_missing_index_group_stats AS migs WITH (NOLOCK)
 INNER JOIN sys.dm_db_missing_index_groups AS mig WITH (NOLOCK)
ON migs.group_handle = mig.index_group_handle
 INNER JOIN sys.dm_db_missing_index_details AS mid WITH (NOLOCK)
ON mig.index_handle = mid.index_handle
ORDER BY index_advantage DESC;
SQL Server profiler
SQL Server Profiler is a tool that allows you to watch and record the requests that are being sent to your database, along with metrics on what it took to run that query. By reviewing all the requests being sent to the server over a given period of time, it is easier to determine if the database is acting slow, or if the Octopus Server is issuing too many, sub-optimal requests (or both!). The following steps outline one way of recording the relevant information, however there are various resources all over the web that will provide deeper tutorials about SQL Server Profiler.
-
Launch SQL Server Profiler and create a new trace. (File ➜ New Trace).
-
Select the database that your Octopus Deploy database instance is located and provide login credentials. (See here for details about the minimum required credentials).
-
Give the trace an appropriate name like
Octopus Deploy - Loading Project 2016-11-12. -
Click the
Events Selectiontab to provide filters that will be applied to the stream of data. -
Disable
Audit LoginandAudit Logout. -
Click
Column Filtersand set the ApplicationName filter to Like=“Octopus %” to filter requests just sent from the Octopus Server.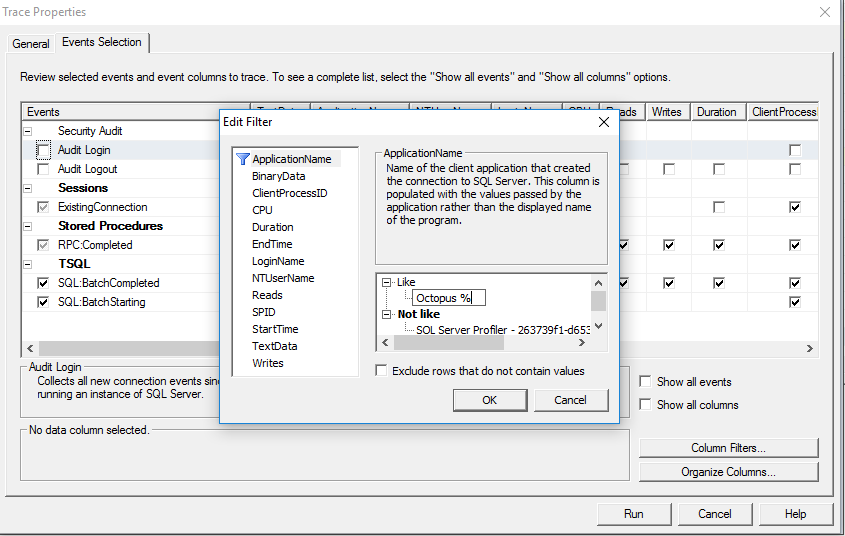
-
Click Run. You will then probably see lots of entries starting to show up. This is because the server is always busy making calls to the database, checking if any new tasks needs to be run or updating the status of existing machines and tasks. Ideally we want this trace to cover just the queries that were invoked while the you perform the operation that appears to cause the server to slow down. Click the
Clear Trace Windowicon to remove the existing entries.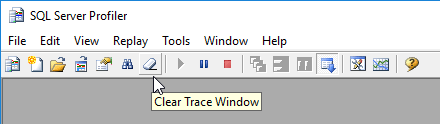 .
. -
Go back to the Octopus Deploy portal and perform the task that resulted in slow performance.
-
Back in SQL Server Profiler, click the red
Stopbutton to prevent any more logs from being added. We want this snapshot to represent as close as possible the operations that were being performed at that point in time. -
Save the results into a .trc trace file and send through with your ticket detailing what steps you ran in the portal.
While this trace may not always provide conclusive proof as to the primary culprit of your performance problems, it may provide some indication as to where improvements can be made to optimize the request profile.
If you are seeing error messages with a specific query in your server logs or through Octopus CLI failures, for example:
INSERT INTO dbo.[Event] WITH (TABLOCKX) (RelatedDocumentIds, ProjectId, EnvironmentId, TenantId, Category, UserId, Username, Occurred, Message, Id, Json) values (@RelatedDocumentIds, @ProjectId, @EnvironmentId, @TenantId, @Category, @UserId, @Username, @Occurred, @Message, @Id, @Json)
Server exception:
System.Exception: Error while executing SQL command: Timeout expired. The timeout period elapsed prior to completion of the operation or the server is not responding.
then it may be more useful to focus in on that specific query and get the execution plan that the database engine is executing. In that case follow the above steps but after step 6, when configuring the filters, include the following steps:
-
Configure filters.
- With the filters dialog open, add a filter to the Text property that matches the table name involved. In the example above we might add the condition Like=“%Event%“. Click
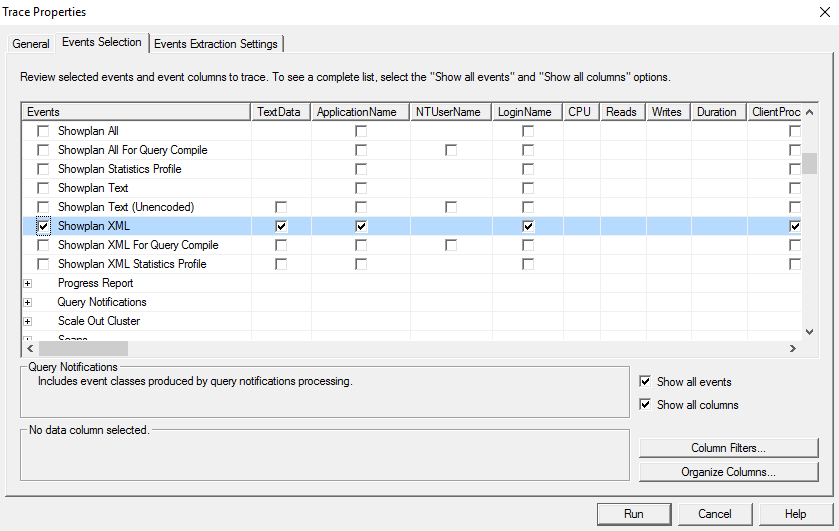
Okand if the message pops up, agree to adding theTextDataevent column. - At the Events Selection tab tick the
Show all eventscheck-box, expand thePerformancesection, and include theShowplan XMLevent. This event will provide detailed information about how the database constructed and executed the query.
As with before, perform the operation causing the error with the trace running then export and send the trace file with your ticket.
- With the filters dialog open, add a filter to the Text property that matches the table name involved. In the example above we might add the condition Like=“%Event%“. Click
Logging queries
Slow running queries are automatically logged to the Server Logs with an Info trace level. These lines will look something like:
2016-11-17 00:31:39.8557 285 INFO Reader took 309ms (1ms until the first record): SELECT * FROM dbo.[Project] ORDER BY Id
By updating your server logging to verbose, further information will be recorded if a large number of concurrent transactions appear to be active at any one time.
2016-08-18 23:59:50.5834   2266  INFO  There are a high number of transactions active. The below information may help the Octopus team diagnose the problem:
Now: 2016-08-18T23:59:50

Transaction with 0 commands started at 2016-08-16T18:38:38 (192,072.09 seconds ago)
Transaction with 0 commands started at 2016-08-16T18:38:38 (192,072.07 seconds ago)
Providing these logs in your support ticket that correlate to the times that you noticed the performance problems will further help us to diagnose what could be improved.
Improvements going forward
Providing as much information as possible regarding what actions you are performing to the server, along with the subsequent requests that the server is making, will best help us to further improve the performance of Octopus for all users. While we can’t guarantee that we will be able to squeeze improvements out of every situation, every bit helps.
Help us continuously improve
Please let us know if you have any feedback about this page.
Page updated on Sunday, January 1, 2023